In recent years, the risk and complexity of managing environmental and safety requirements have grown exponentially for heavy industrial, manufacturing, and building materials companies. As the scope and scale of their EHS compliance operations grows, data reporting and risk management have turned into a massive time investment for staff, requiring them to hunt down relevant compliance information from different facilities, data sources, and regulatory requirements. Unfortunately, this process is slow, error-prone, and creates data silos that leave companies vulnerable to quality deficiencies and compliance gaps.

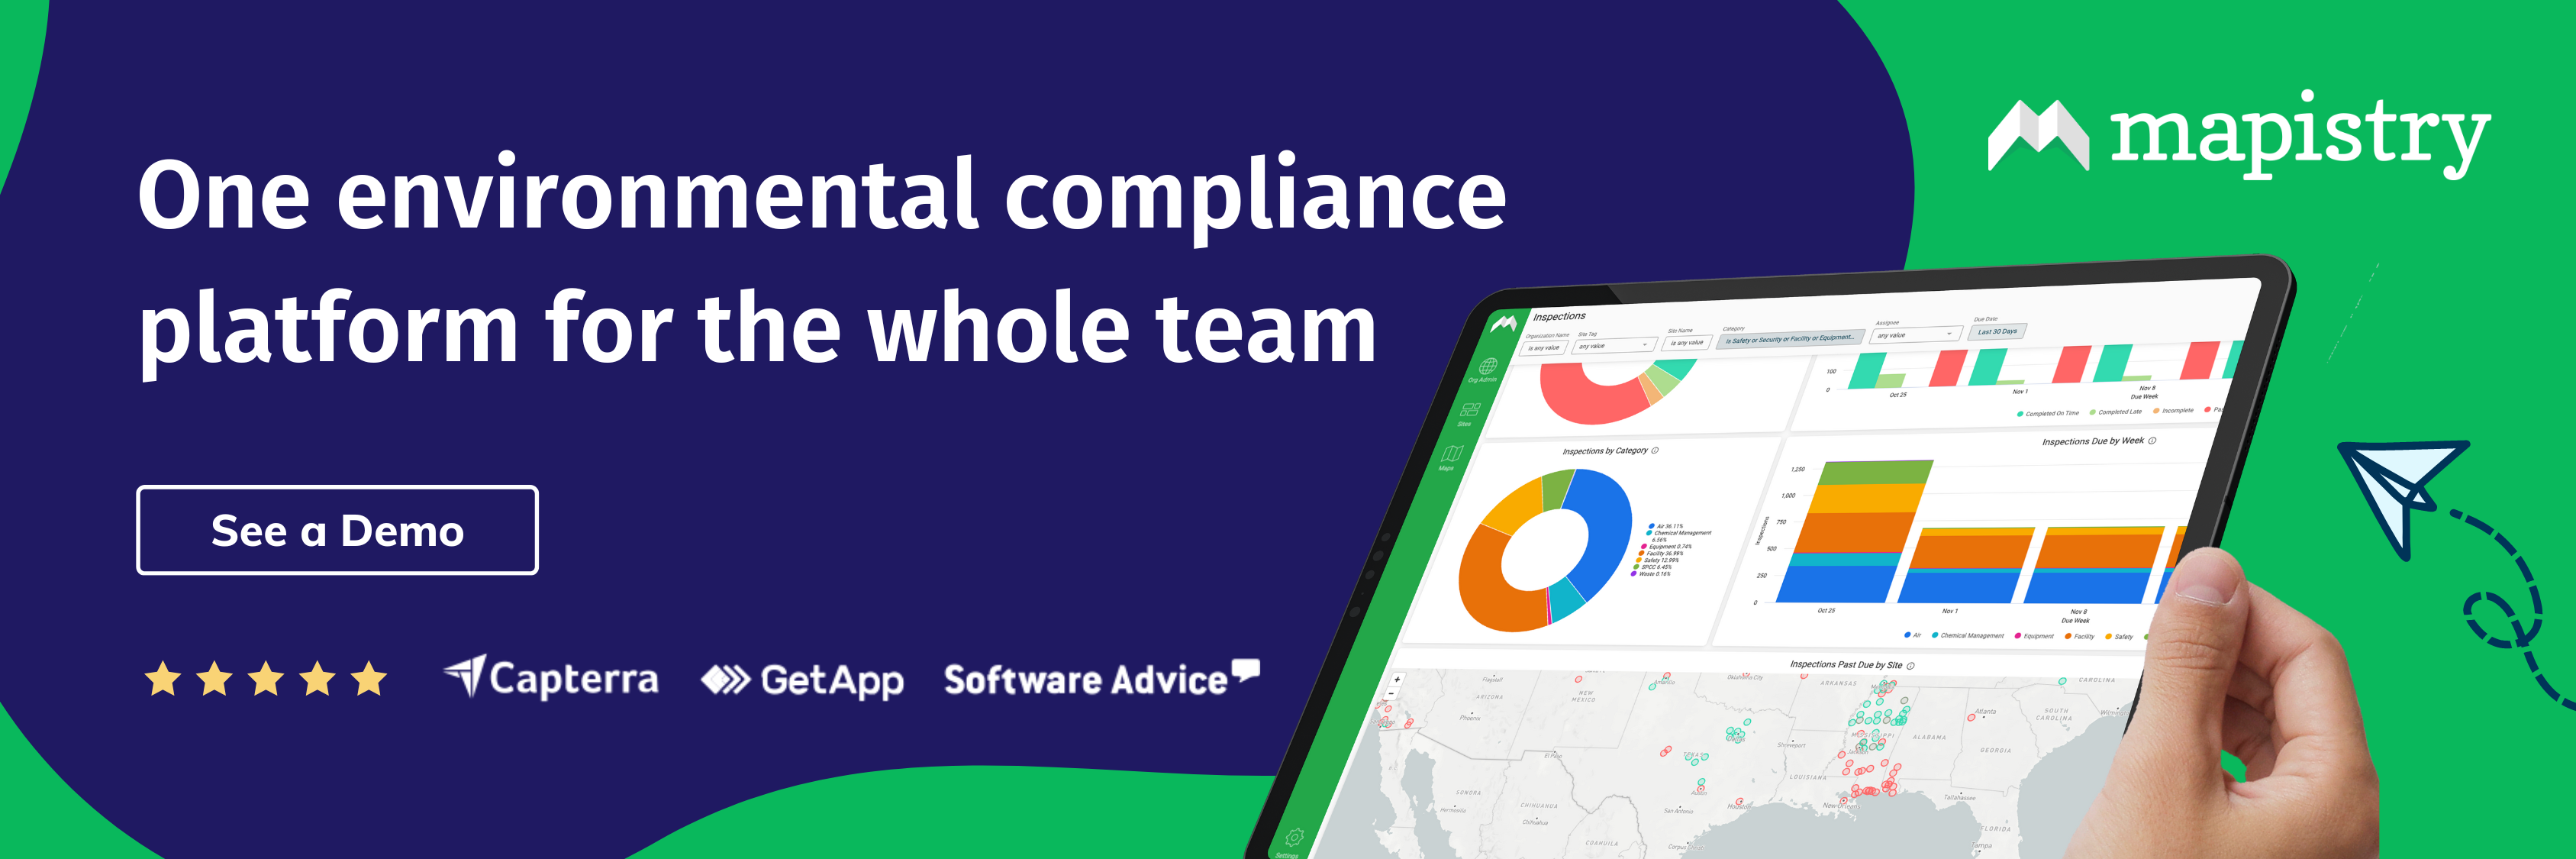
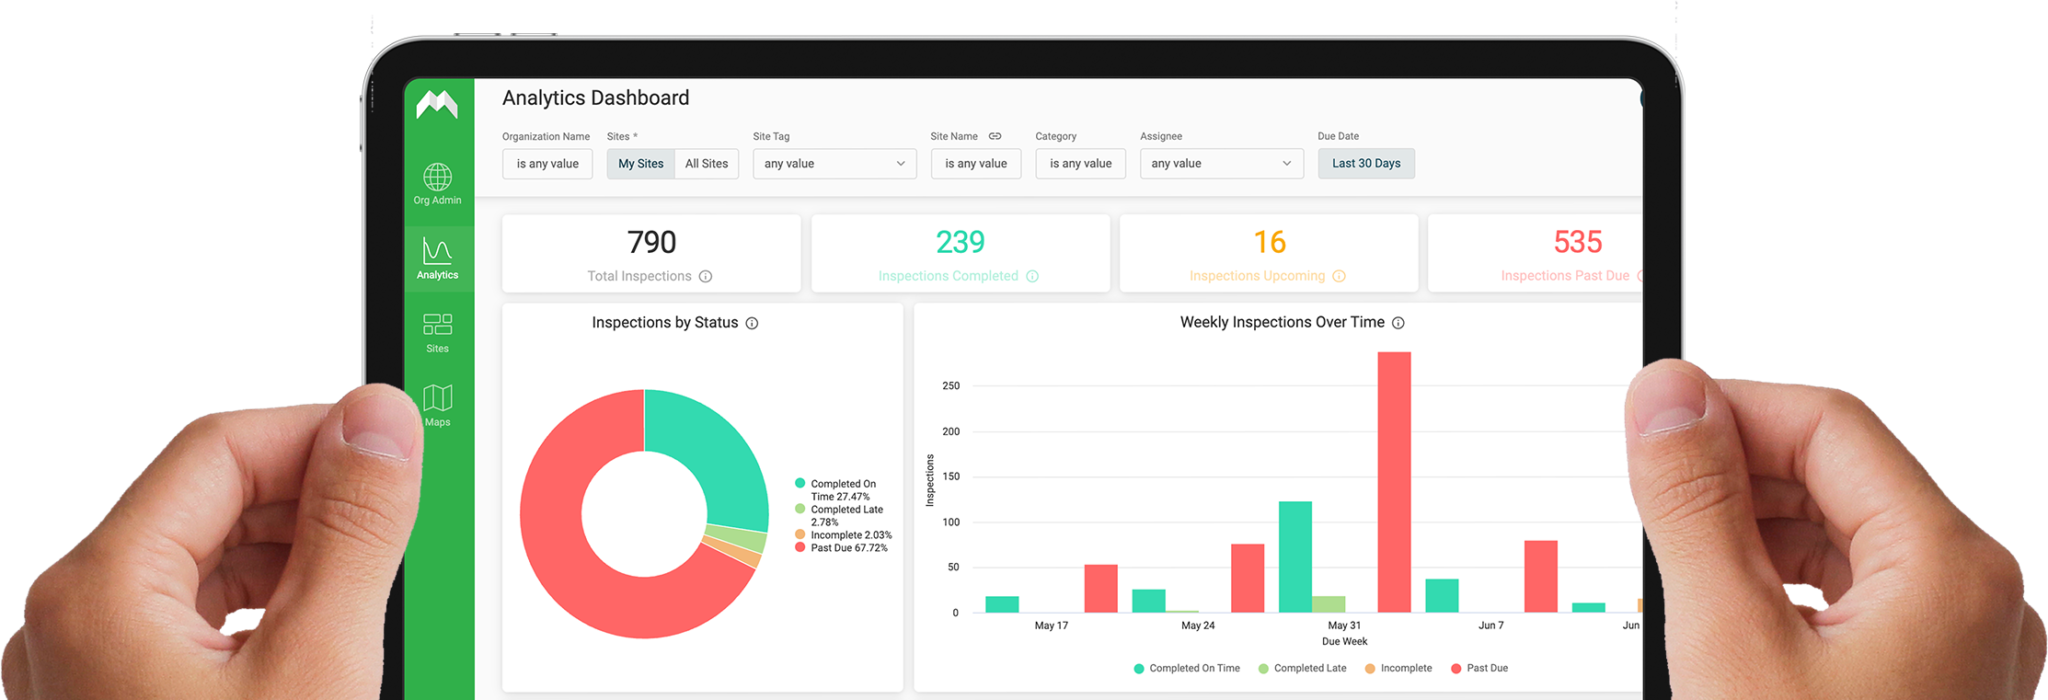
To solve this problem, I’m excited to announce that Mapistry has launched a new analytics platform that brings environmental and safety data together into compelling, ready-made dashboards that empower teams with actionable views of compliance risk and program quality across the enterprise. Mapistry helps you break down silos between teams by making it easier for field workers and managers to quickly access compliance data in real-time, share insights and proactively detect issues before they turn into bigger problems, regulatory fines, or even lawsuits.
Turning EHS data into actionable insights
The new dashboards will create a paradigm shift in the way customers glean information and drive action from the Mapistry Platform. Depending on their current Mapistry solution, customers will now have access to purpose-built dashboards that provide valuable insights into program quality and performance. For example, if they use Mapistry to manage stormwater, they can now use a simple ‘Stormwater’ category filter to track the compliance health of all their facilities with stormwater permits. Staff can quickly assess and identify potential problem areas such as missed inspections or overdue tasks and they can use interactive filters to drill into site-specific details to analyze the context or to evaluate outliers. Here’s an overview of the new features in this release:
-
Regulatory Dashboards – Create pre-defined consistency across all of your facility locations and support regulatory compliance for stormwater, hazardous materials, SPCC, wastewater, and air compliance
-
Task Intelligence – Track progress on assigned tasks, corrective actions, or projects; track task volume, status, or completion rates; identify productivity lags, performance gaps, and understand resource limitations.
-
Interactive Dashboards – Analyze through layered drill-downs; tap into advanced filters to analyze project details; identify trends and proactively make improvements
-
Schedule Dashboard Delivery – Easily share dashboards with internal stakeholders with customizable scheduling
-
Embedded Mapping Feature – Visualize data across specific sites, states, or regions
-
Automated Alerts – Create configurable triggers when specific conditions are met (exceeding permit limits, trending below company KPIs, missing mandatory inspections, etc.)
-
Inspections – Track the performance of mandatory site inspections across your facilities and regulatory areas; evaluate results by type of inspection, site location, status, or tag; ensure your sites are completing inspections on-time; establish and track company-wide KPIs
-
Compliance Log Dashboard – Automate and visualize advanced calculations such as air emissions monitoring, hazardous waste tracking, basin depth tracking, and even sustainability reporting around fuel usage, etc.
Want to learn more?

