.svg)

.svg)

.svg)
.svg)
.svg)
%201%20(2).png)

.svg)
.svg)


.svg)
.svg)
Monitor environmental compliance
It’s impossible to spot compliance issues working out of spreadsheets and paper forms. Get complete visibility with compliance dashboards and analytics.
.png)
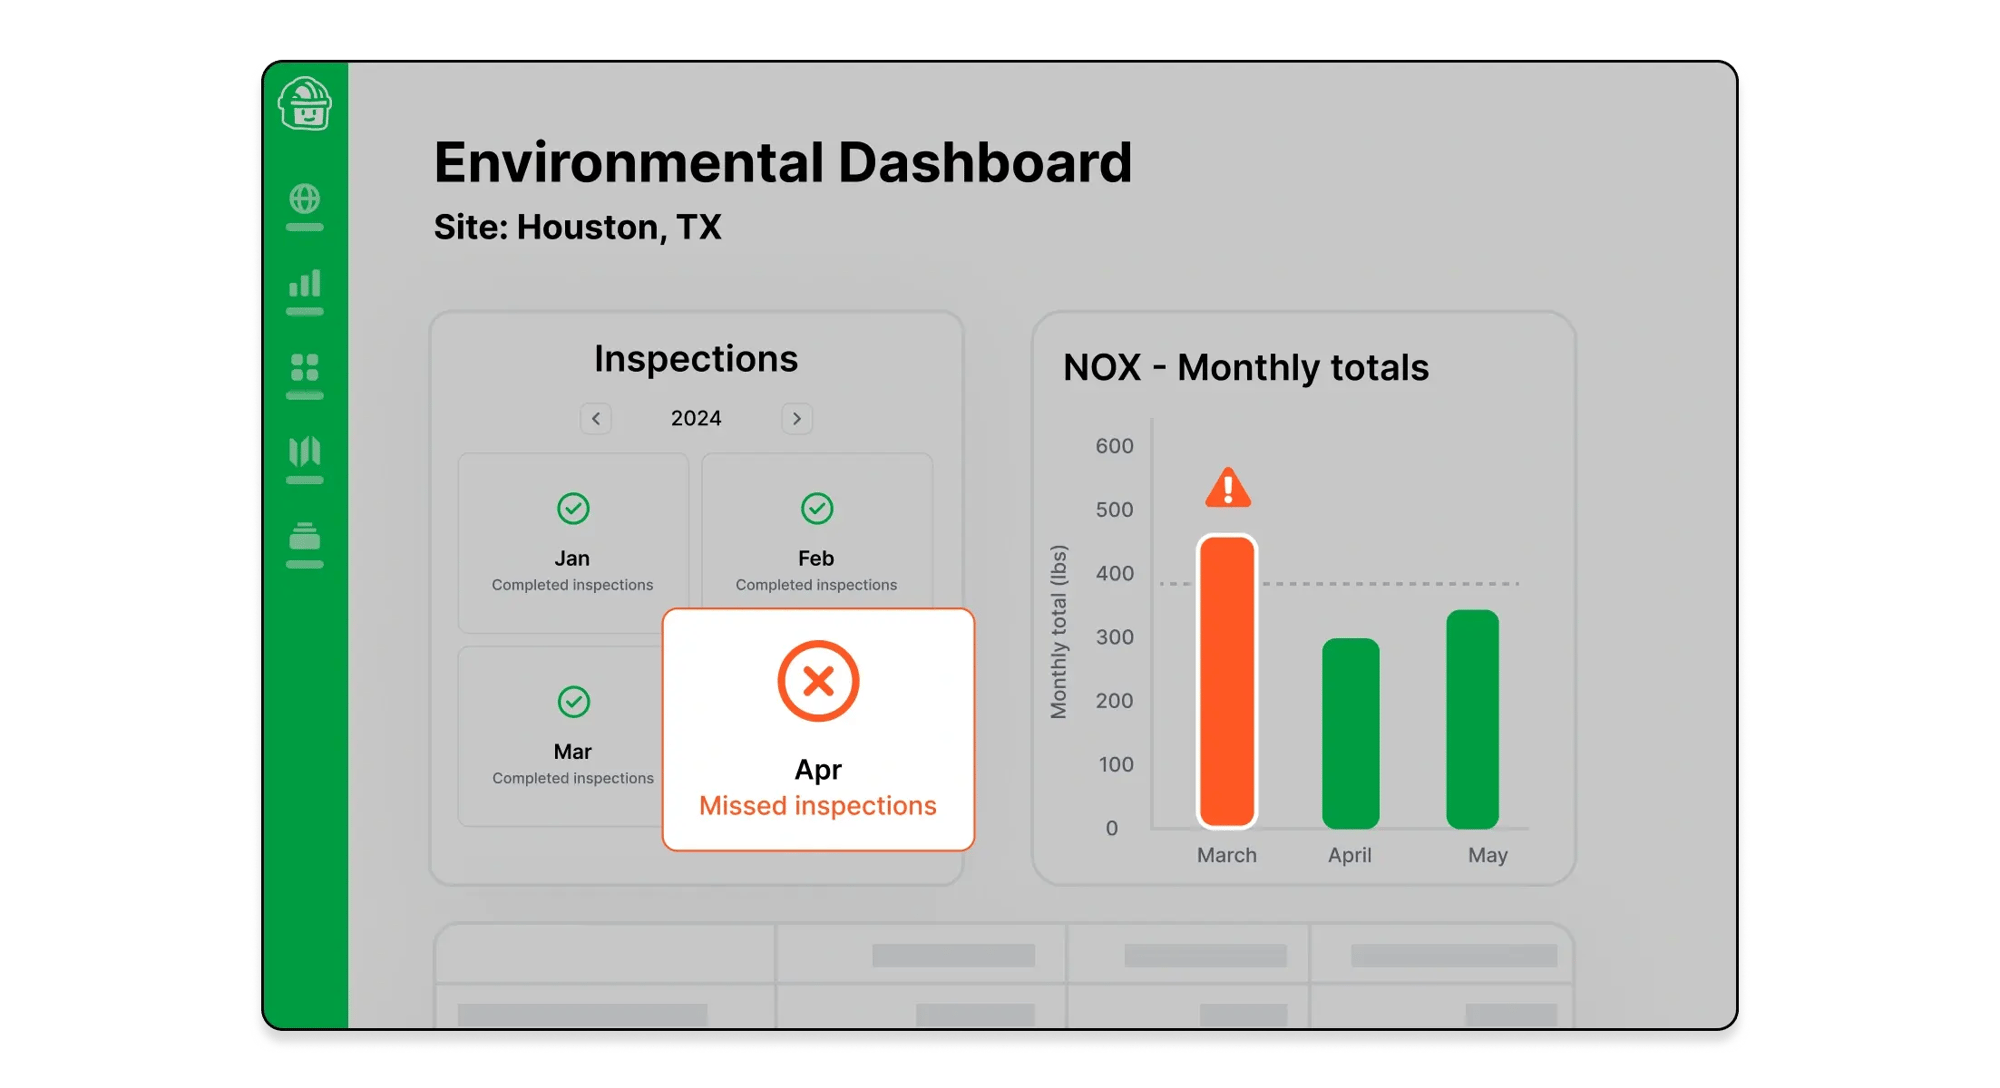
Get a bird's eye view of compliance
Never get caught out of compliance again.
Immediately catch compliance issues with one look at your Mapistry dashboard.
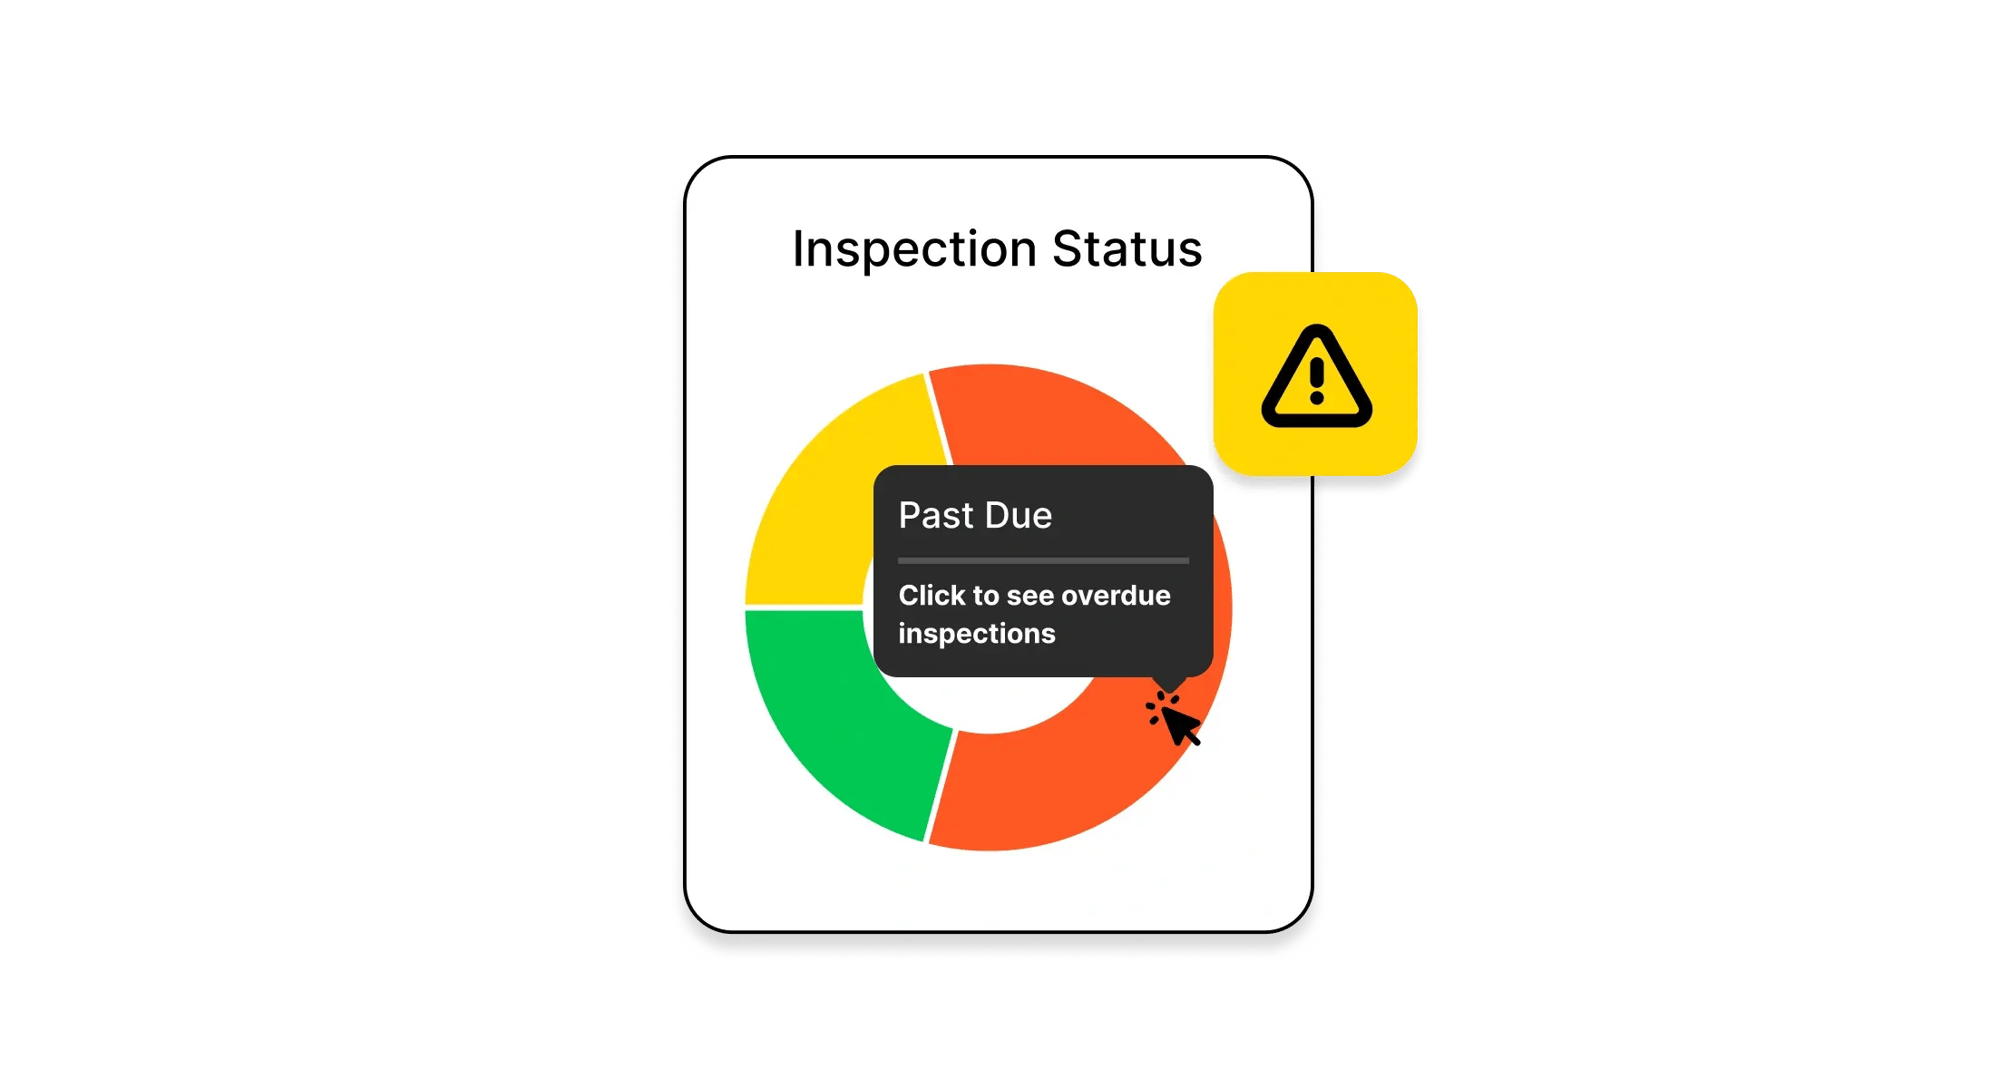
Find out what’s causing the problem
Understand and resolve problems without playing phone tag with your team.
Dig into issues by using your dashboards drill-down feature, e.g., to see which location is out of compliance.
Track your KPIs in real-time
Gone are the days of spreadsheets with outdated information.
Integrate with your existing systems to get real-time data, and keep an eye on your KPIs from your dashboard.
-1.webp?width=2000&name=Image%20(1)-1.webp)
Keep leadership posted
Boss likes to keep close tabs on compliance? Not a problem.
Send out weekly or monthly reports with Mapistry’s automated reporting templates and save yourself hours of PowerPoint fun.
-3.webp?width=2000&name=Image%20(1)-3.webp)