.svg)

.svg)

.svg)
.svg)
.svg)
%201%20(2).png)

.svg)
.svg)


.svg)
.svg)
Automate environmental data collection
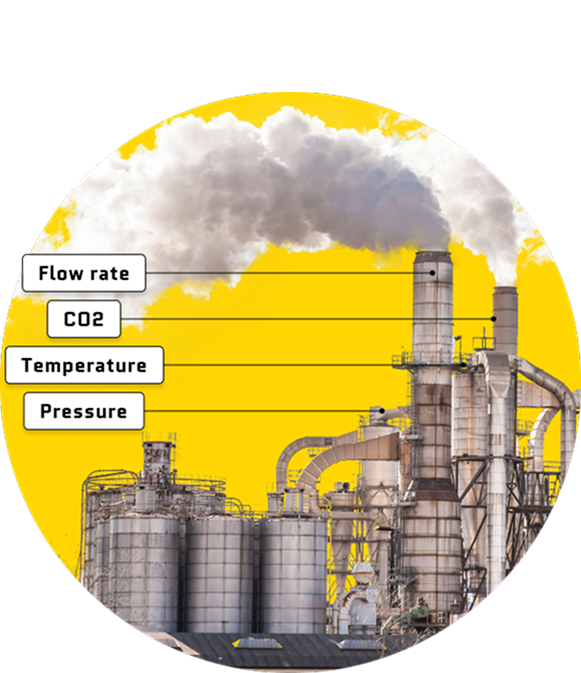
Tap into data from your existing systems
Mapistry centralizes communication and task management, so you can finally ditch those endless email chains.

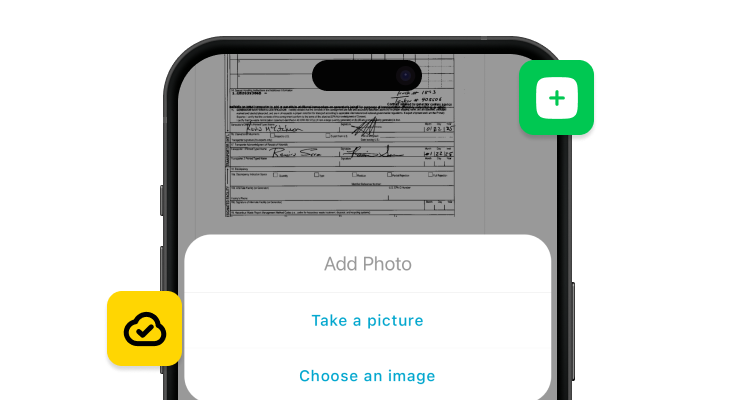
Automatically extract data from Excel files, PDFs, and more
In the past, you had to enter data from PDFs or paper forms into your “master spreadsheet”. It’s soul-sucking work, and typos are common.
With our AI, you can automatically extract this data and import it to Mapistry in minutes:
- Digitize waste manifests with your phone
- Upload PDF lab reports or any kind of spreadsheet
- Pull data from email invoices
Easily log data on the go
Stop chasing down data from operations. Mapistry’s intuitive app lets them log data from the field, easy as pie.
It’s less work for everyone, and your data is always up-to-date.
.png?width=735&height=400&name=Image%20(1).png)
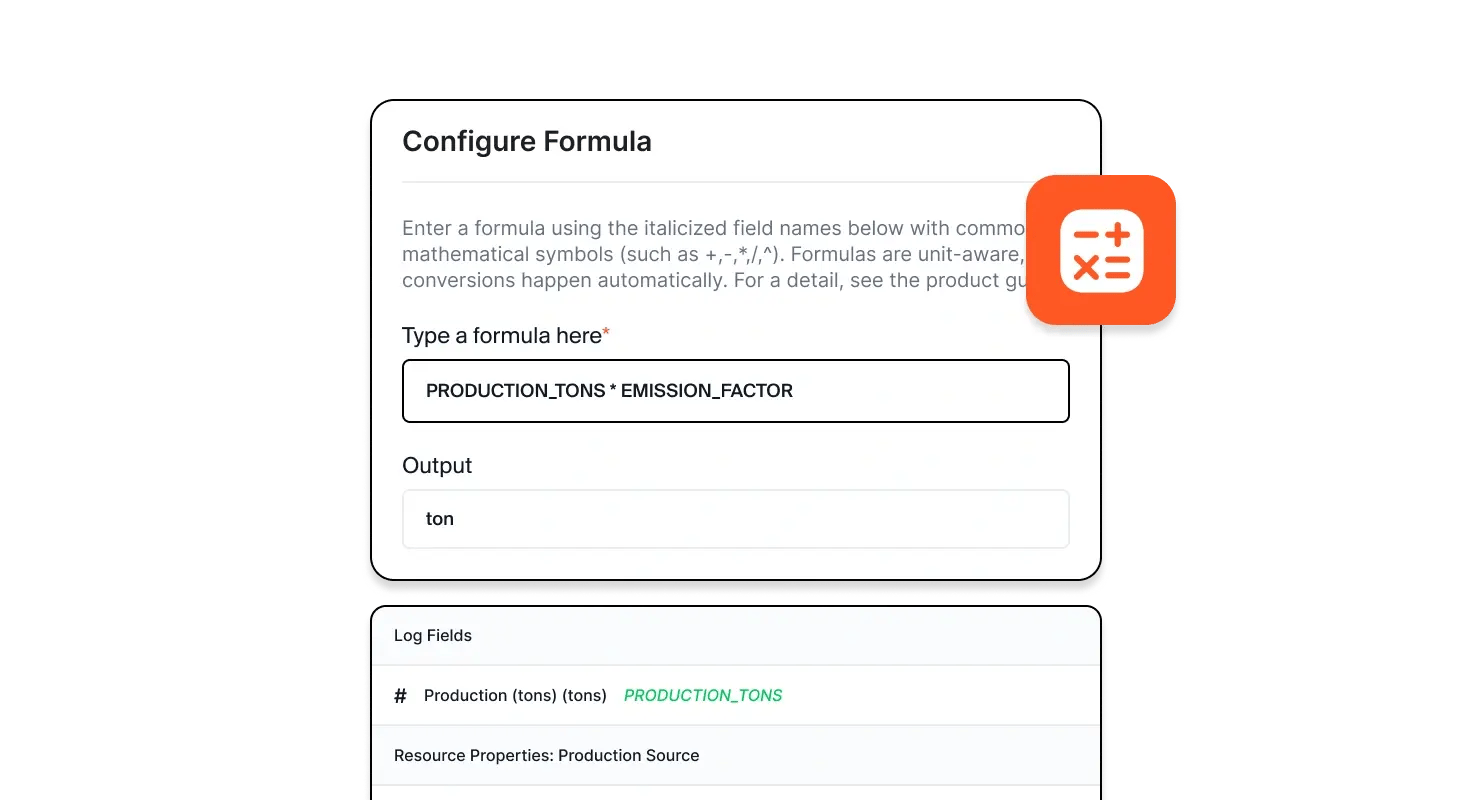
Create calculations, easy as Excel
Love tracking permit limits in Excel? Great!
Mapistry’s formula builder makes it just as easy and has error-proofing built in.
Get alerted before crossing limits
No more accidental limit exceedances. Mapistry automatically sends you an email alert when you're close to hitting your limits.
.webp?width=2000&name=Image%20(1).webp)
.svg)
.svg)
.svg)