.svg)
.svg)
.svg)
.svg)
.svg)
%201%20(2).png)
.png)
.svg)
.svg)
.svg)
.svg)
.svg)
Automate environmental data collection
Tired of punching data into permit limit spreadsheets? Get your life back with automated data collection, AI-assisted uploads, and mobile data entry.
Data entry?
Never again
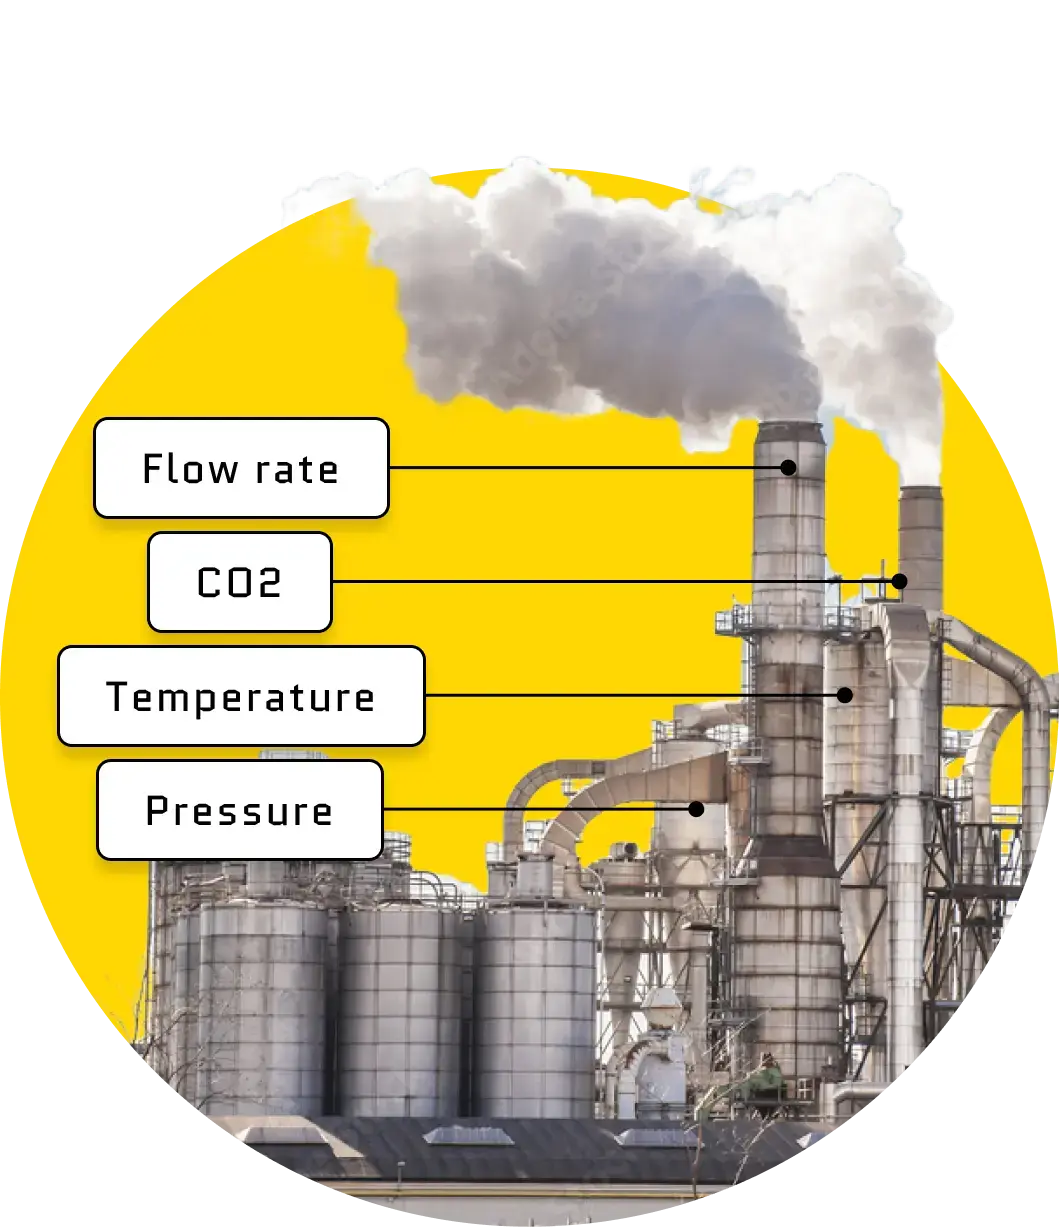
Tap into data from your existing systems
Mapistry centralizes communication and task management, so you can finally ditch those endless email chains.

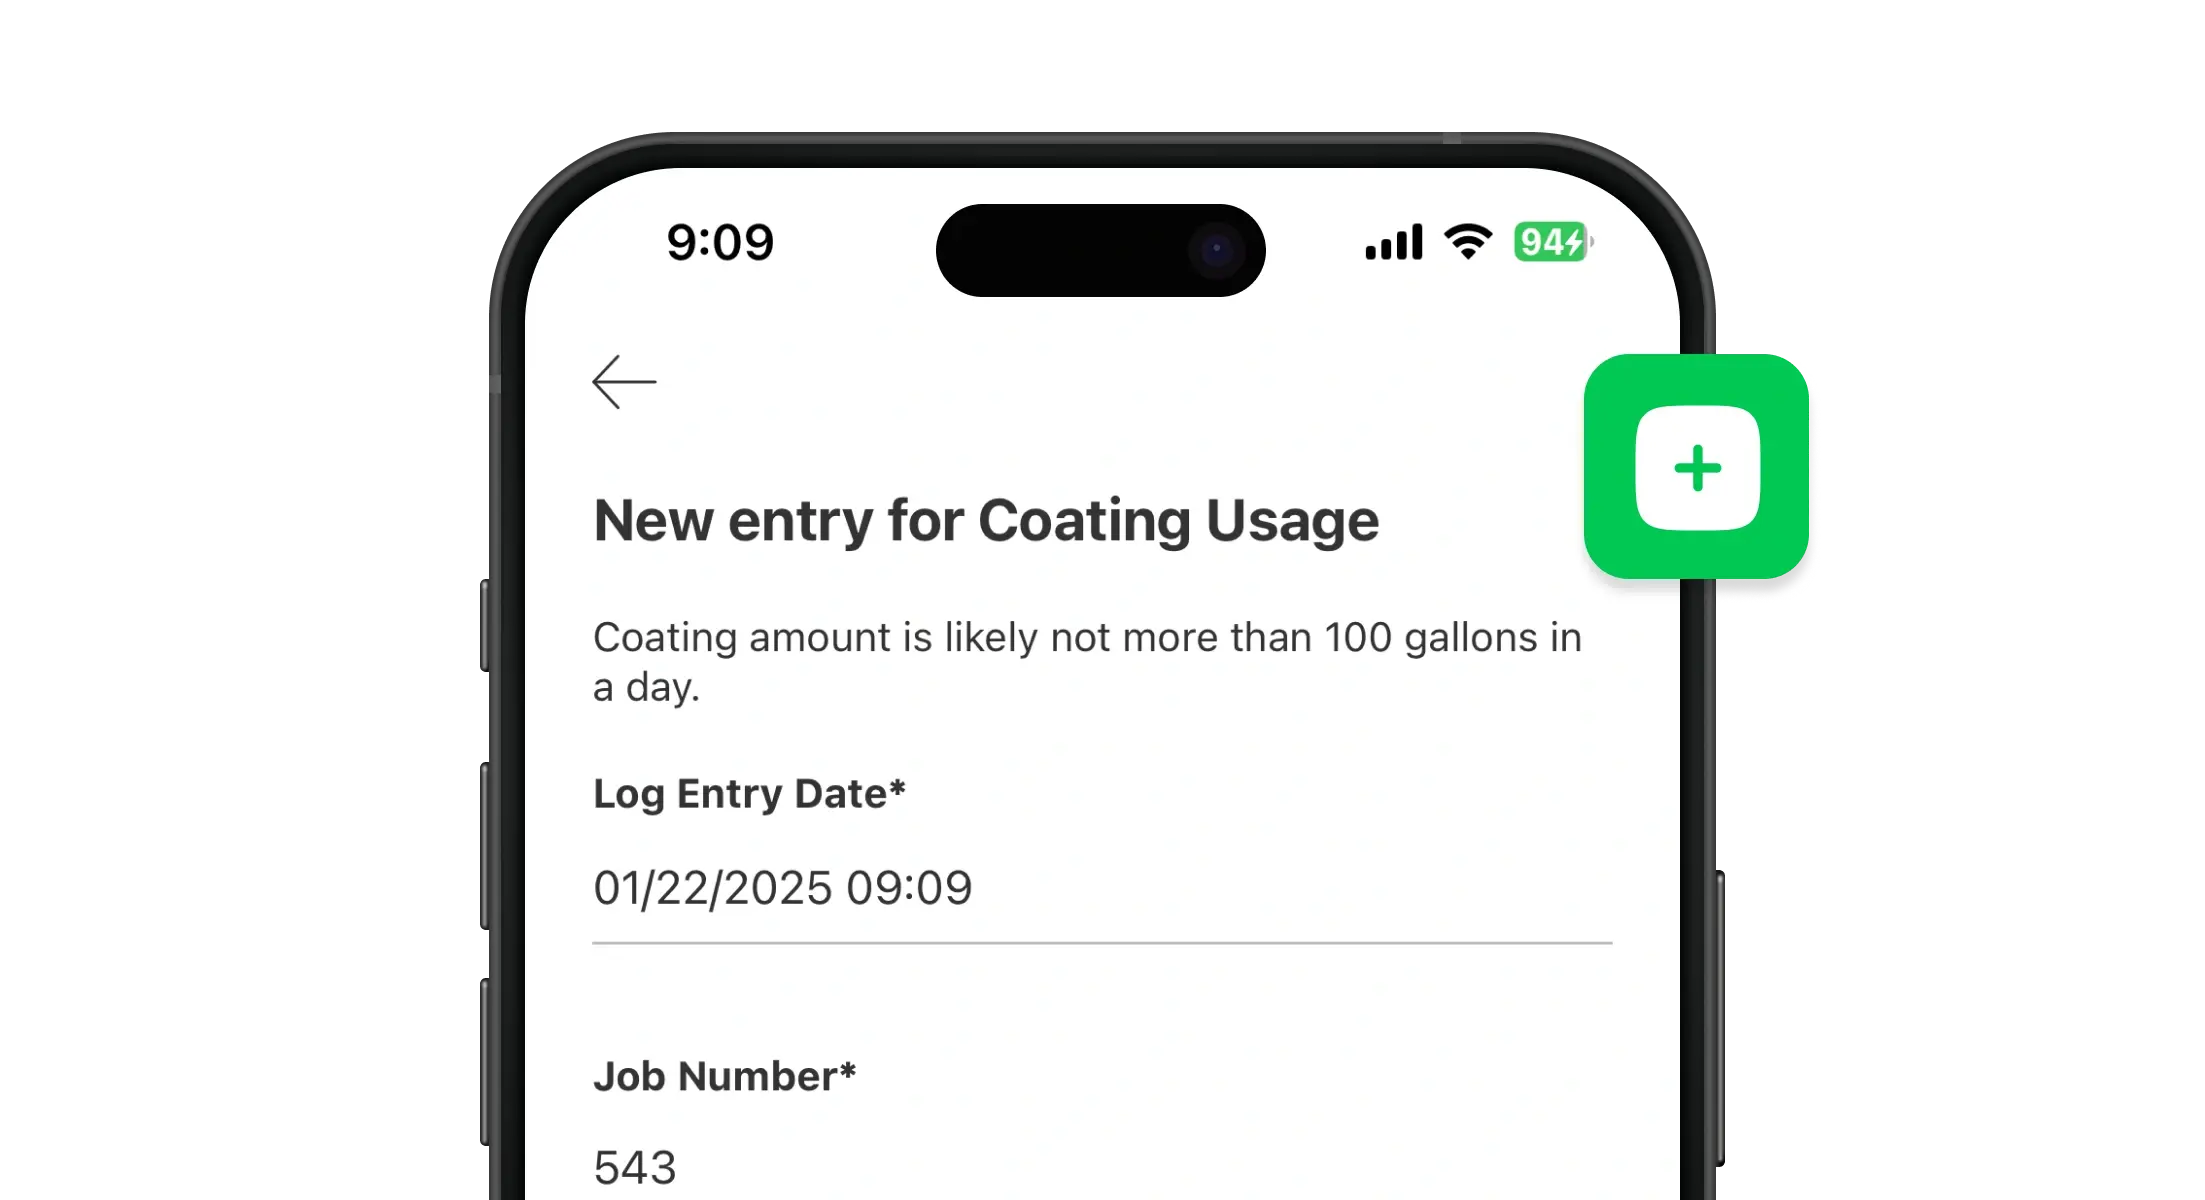
Easily log data on the go
Stop chasing down data from operations. Mapistry’s intuitive app lets them log data from the field, easy as pie.
It’s less work for everyone, and your data is always up-to-date.
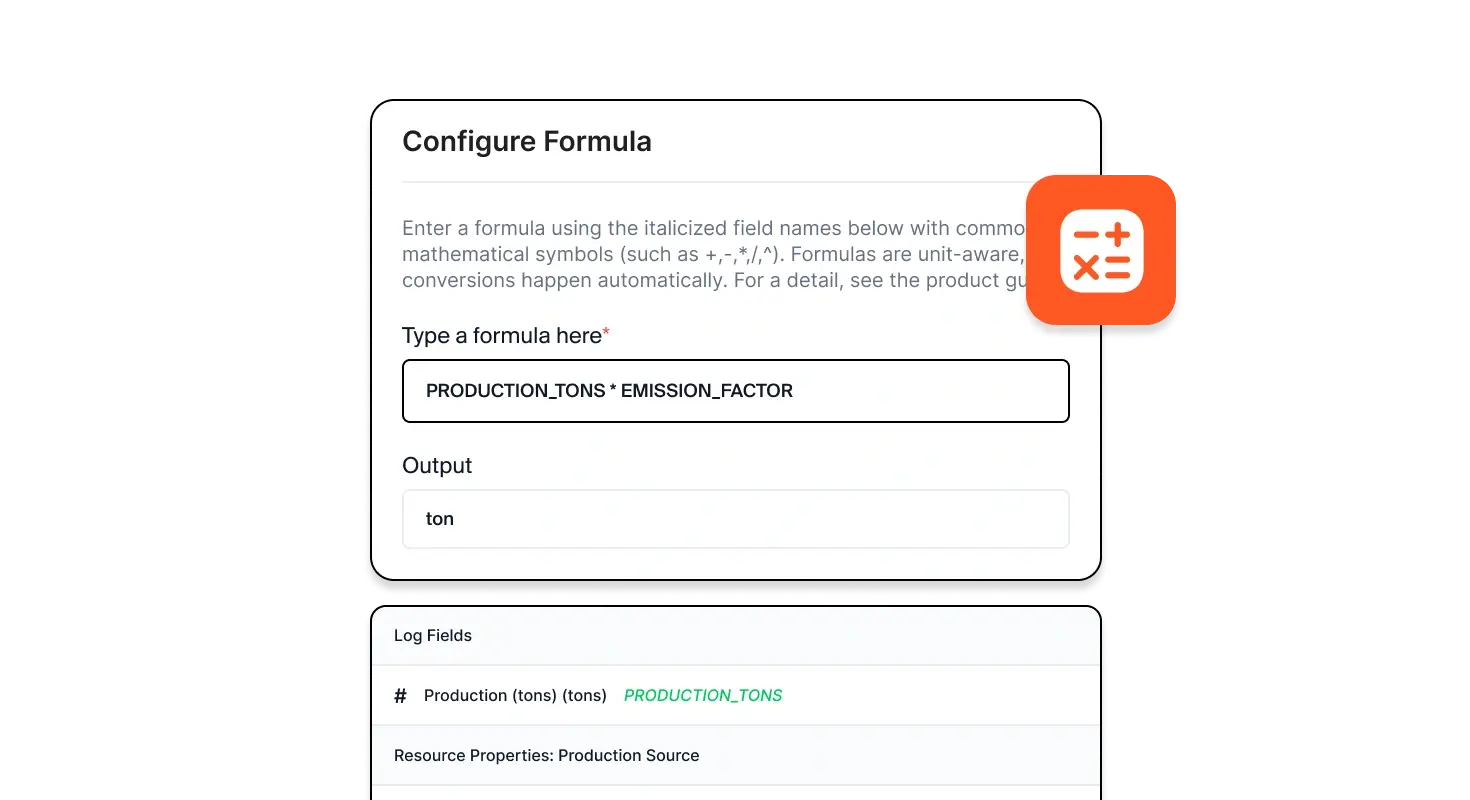
Create calculations, easy as Excel
Love tracking permit limits in Excel? Great!
Mapistry’s formula builder makes it just as easy and has error-proofing built in.
Get alerted before crossing limits
No more accidental limit exceedances. Mapistry automatically sends you an email alert when you're close to hitting your limits.
.webp)
Always ready for reporting season
All your data is already stored in Mapistry. No need to chase down operations.
Just export your data to Excel and submit it to regulators. Reporting season has never been easier.
.webp)
.svg)
.svg)