Covered in This Product Guide
- What is a Report?
- Creating a Report and Common Use Cases:
- Instantaneous/Raw Data Report
- Monthly & 12-Month Rolling - Total Resource Usage
- Monthly Usage & 12-Month Rolling - By Resource
- Annual Total Usage
- Customize Columns
What is a Report?
A Report is a saved set of Aggregations, Rolling Calculations, Filters, and Limits that allow you to configure and see your data in various ways and export the necessary and relevant data when needed.
Creating a Report (Overview)
To create a Report, go to the "Log" page and click on "Reports"

Click on "Create new Report" and select the Data Source to create the report off of (usually the Data Source should be a Workflow, but could also be a Log)
Selecting a Data Source When Creating a Report
When creating a Report (or View), only Data Sources that are enabled for a site will appear for selection.
Data Sources include Logs, Resource Types, and Workflows.
Available Data Sources
The list of available Data Sources is automatically filtered based on your site setup:
-
Logs — Must be published and have a frequency set up on the site.
-
Resource Types — Must have at least one resource associated with the site.
-
Workflows (based on Logs) — Must include at least one Log that is enabled for the site.
-
Workflows (based only on Resource Types) — Must include at least one Resource Type that has resources for the site.
If a Data Source that doesn’t meet these conditions is selected, the Report can still be created, but it will not return any results.
Tip: If you don’t see a Log, Resource Type, or Workflow you expect, check whether it’s been published or has the correct frequency or resources assigned.

Use query steps to build necessary aggregations, rolling calculations, and set limits.
- Typical order of operations within a Report is (0) filters (if applicable); (1) aggregations (if not already performed in the workflow); (2) rolling calculations; (3) limit step
- Click "Run" at any point to see the data preview update to check whether the output is what you expect


When a Report is saved, you can hide, change the order of, and/or rename columns as necessary 
Instantaneous/Raw Data Report
This Report allows you to see entered raw log data with formula fields and resource properties. To create this Report, create a Report with no steps.
Step 1: Create A Report
After clicking on the Reports tab, click the 'Create New Report' button.

Select the Data Source to create the report off of (usually the Data Source should be a Workflow, but could also be a Log)
Step 2: Save Report
As no additional formulas or queries are being run on our existing log data, we'll be saving this Report as is. To do so, click on 'Save Report.'

Enter a name for your Report and a description. In this case, we'll call this Report 'Paint Log Emission Calculations - Instantaneous/Raw Data Report & Calculations'

You'll then see your created Report under 'Reports.'

Monthly & 12-Month Rolling - Total Solvent Usage
Step 1: Create A Report
Specify the solvent log/workflow as the Data source
Step 2: Set Up Data Aggregations
Aggregate By
An aggregation is a summary of your data in Mapistry. Aggregating your data can be helpful in keeping track of your emissions and creating and presenting Reports that are in compliance with your permits.

Select 'Monthly' as we want this to be a monthly rolling average. Fill in all the other fields.
💡Fields marked with '*' are required fields.

Click on 'Add Aggregation' to add an additional query.

Group By
In this case, we won't be grouping any columns, as our aggregations will be calculated across all solvents.
💡 The 'Group By' function categorizes your data based on specified columns. This allows you to perform calculations and aggregations on the grouped data. You can also utilize the grouped data as a variable when creating rolling calculations or analyzing trends over time.

Step 3: Set Up Rolling Calculations
Here, we will be creating two rolling calculations: 12-Month Rolling Total Usage Volume and 12-Month Rolling Total Usage Weight.
💡A rolling calculation is a time-based calculation that spans a specific duration and adjusts as time progresses. It covers a consistent period of time, regardless of when it's checked. For example, a rolling calculation that covers the previous 12 months will always cover a 12-month period, regardless of when it is checked.
12-Month Rolling Total Usage Volume
To create a new rolling calculation, click on 'Rolling Calculation.'

Select the column you would like this calculation to be performed on - in this case we will select the 12-Month Rolling Total Usage Volume column. As this is a rolling sum over a year period, we also select 'Sum' in the 'Perform a rolling' drop-down menu, and type in '12' in the 'Months' section.

12-Month Rolling Total Usage Weight
Repeat the steps above in the '12-Month Rolling Total Usage Volume' section, selecting the 'Monthly Total Usage Weight' column.
Step 4: Creating Limits
Adding a limit to your rolling calculation will give you great visualization of possible exceedances, as required by your permit. We strongly recommend adding this step to your Reports.
To add a limit, click on 'Limit.'

Select the limit type for your log. Our log has a determined maximum value, so we will select the 'Maximum' limit type and the determining column.

Now that all our settings have been added to this Report, click 'Save Report' in the top right corner of your screen.

Monthly Solvent Usage & 12-Month Rolling - By Solvent
Step 1: Create A Report
Specify the solvent log/workflow as the Data source
Step 2: Set Up Data Aggregations
Here, we will set up two monthly aggregations; Monthly Solvent Usage Volume and Monthly Solvent Usage Weight. We'll also split the aggregated data under 'Group By' by selecting the 'Solvent Used' column.
💡 To add more than one aggregation, click on 'Add Aggregation.'

Step 3: Set Up Rolling Calculations
We'll set up two rolling calculations that perform rolling additions over the preceding 12 months and select the 'Monthly Solvent Usage Volume' and 'Monthly Solvent Usage Weight' columns to calculate on.


Step 4: Creating Limits
Here, you can create limits as required by your permit. We'll select each solvent used and add a limit for each solvent used. To do this, click 'Add limit to another group by value.' This data will be calculated on the '12-Month Rolling Solvent Usage Volume' column.
💡The limit type will depend on your permit requirements. In this case, our limiting factor is the maximum value, which is why we select 'Maximum.'

Now that all our settings have been added to this Report click 'Save Report' in the top right corner of your screen.
Annual Total Solvent Usage
Step 1: Create A Report
Specify the solvent log/workflow as the Data source
Step 2: Set Up Data Aggregations
This is where we'll create a data aggregation that will sum the data over a year's interval, and aggregate on the 'Usage by Weight' column.

Step 3: Creating Limits
This is where you can create a limit as required by your permit. Select the column you'd like to base the limit on by selecting a column under 'Column Name.' We'll select the 'Annual Total Solvent Usage Volume' column in this case.

Now that all our settings have been added to this Report click 'Save Report' in the top right corner of your screen.
Customize Columns
Once you save your report, you can customize the columns you see when you come to view your report.
-
If you are still editing your report, Save your Report, and exit back to the main Report viewing page.

- From the main Report page, find the "Customize Columns" button in the upper right
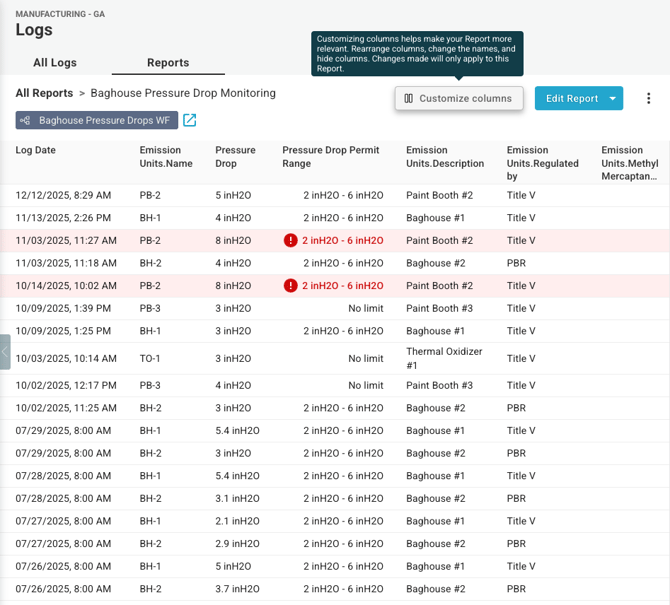
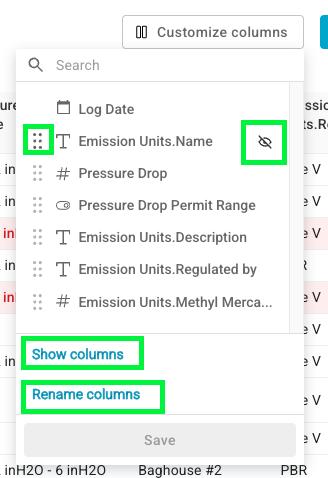
- "Customize Columns" will allow you to:
- Rearrange the column Order (use the 6 dots on the left of a column name to drag and reorder columns)
- Hide/Show Columns from the Report (use the hide icon to the right of a column name to hide it. Click on "Show Columns" at the bottom to see columns that have been hidden that you can add back to the Report)
- Rename Columns (click on "Rename columns" to make all column names editable to rename them)
- Click "Save" after making any changes. After clicking "Save", the Report will reflect your changes
- When you export your Report, the exported file should match your column customizations
End of Article
Support
If you have any questions or need further assistance, please e-mail help@mapistry.com.